
To comply with Twitter’s privacy rules full datasets cannot be published on the web, but they do allow tweet identifier datasets to be shared. This tutorial will show you how to take these identifier datasets and return them to their original JSON or CSV form for analysis. It will then show you how to clean your data with a basic Python script and then import it into Gephi for visualisation.
This is part of my using Twitter data for research series.
1. Downloading a Dataset
1.1. Your first job will be to find a data source that contains information you need for your project. There are a selection of datasets listed here. For this example though we are going to take some work from George Washington University.
1.2. Visit https://tweetsets.library.gwu.edu/ and click ‘Get Started’
You will be presented with a list of the Tweet Datasets that are available to download.
1.3. Clicking on each will present you with additional information about who made it and the time frames it covers
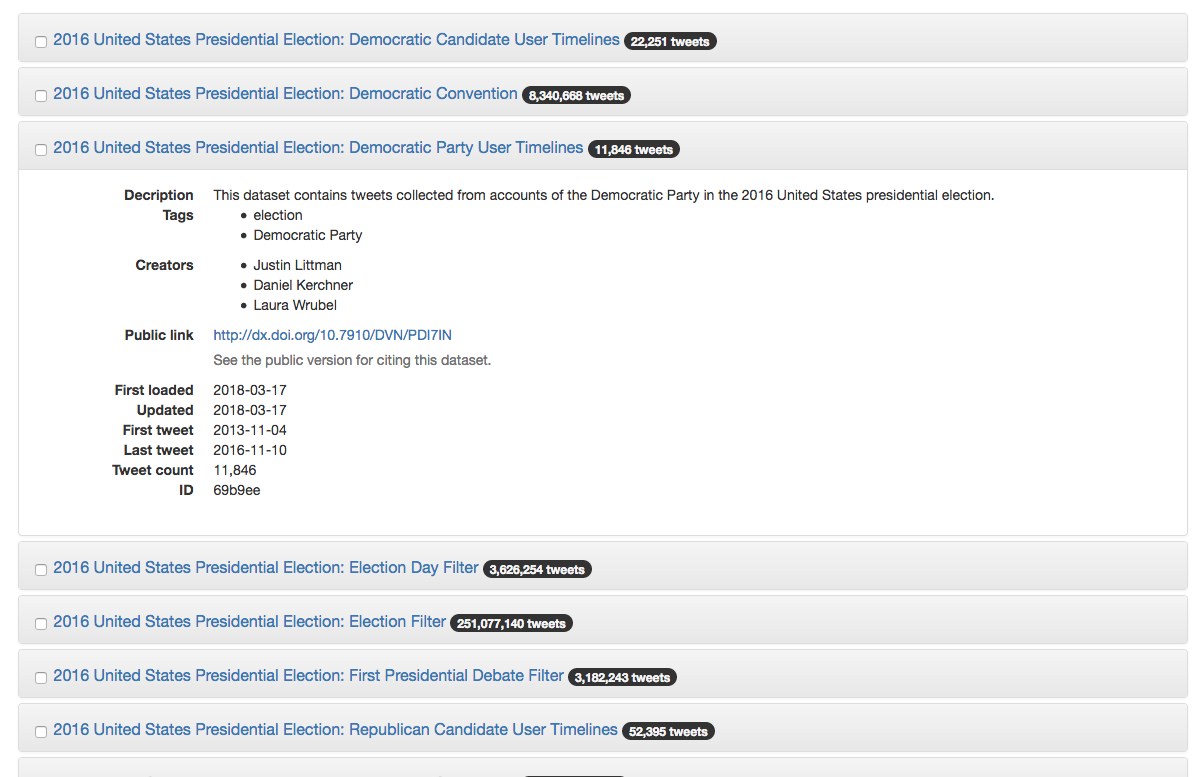
1.4. Once you have selected the dataset you want, tick the box next to it’s name
1.5. Scroll to the bottom of the page and choose ‘Select’
1.6. You can now choose to only download some of the tweets from the dataset by entering values into some or all of the fields presented to you:
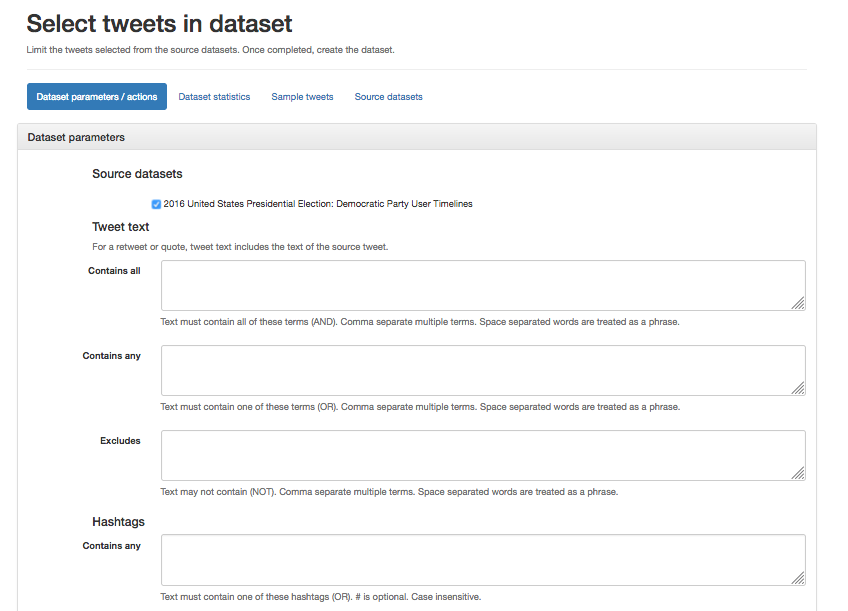
Some of the datasets provided are huge, and will take many hours to process. It is worth thinking carefully about which parts of the data you might need for your work. Just some hashtags, just some users, only original tweets, or also retweets? Is there a time frame you are looking at? Or do you need the tweets to be geotagged for putting them on a map?
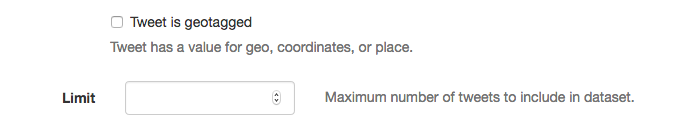
You can also limit the number of tweets in the output, and this will speed up the process of looking at the data, although you may miss something.
1.7. You can now preview the kind of data that you will get from your query.
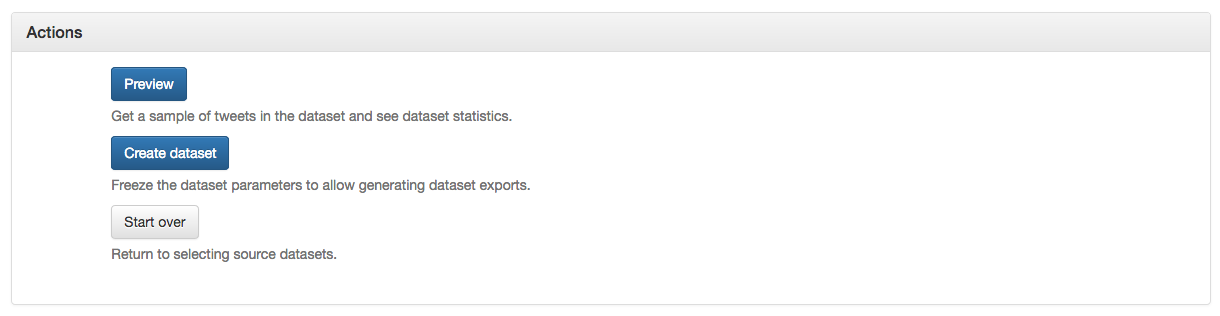
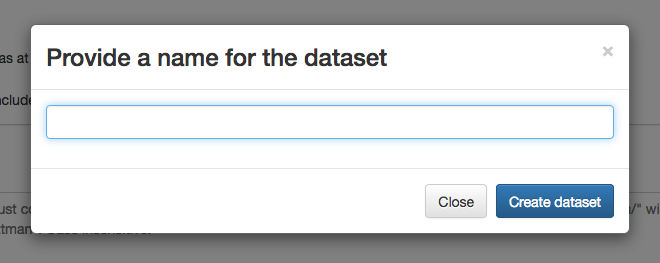
1.8. If you are happy with the data you can click ‘Create dataset’
1.9. You will be asked to give your files a name, make this something clear and memorable
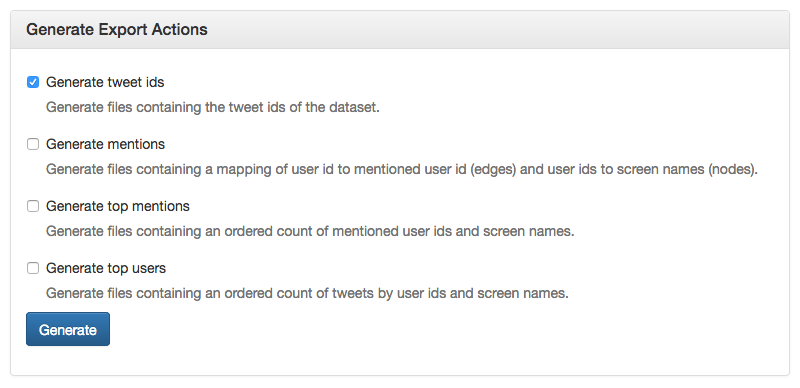
1.10. You will now be asked which parts of the data you want to download. We will need the tweet ids for our task.
We can also use mentions which with some additional work can be used in Gephi – However not all datasets will have these files, so we will work with just the tweet ids for now.
1.11. Once your files are generated you can download the zip files
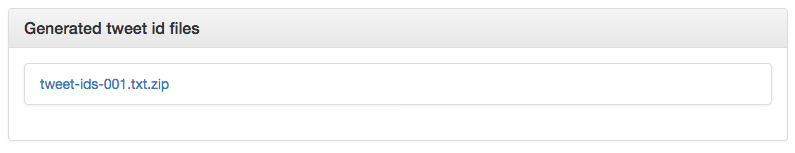
1.12. Extract this into a folder for this project

You are now ready to hydrate the tweet ids and get the full set of data from them.
The tweet-ids file that you generated in the previous stage is little use to us. Opening it in a text editor shows us nothing more than a string of numbers. These are identifiers of tweets used by twitter.
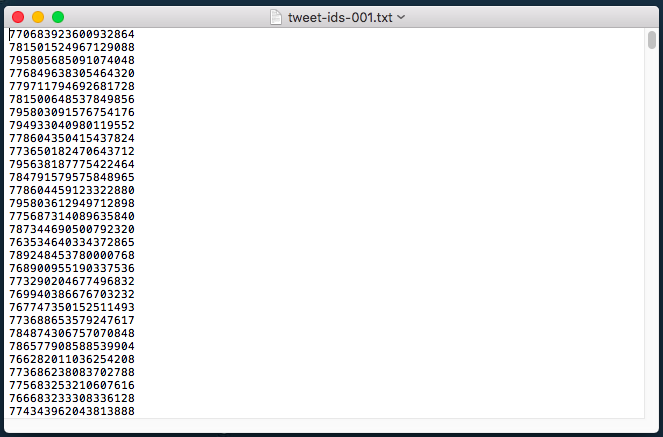
These numbers link to the URL of each tweet, for example:
![]()
These are not much use to us on there own, so we need to hydrate them using the steps below
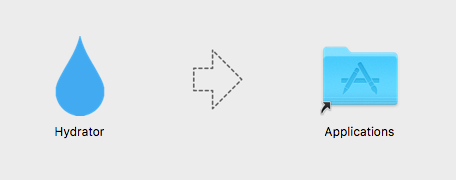
1. Download and install Hydrator
1.1. Visit the Hydrator Github page – we will go straight to the prebuilt versions: https://github.com/DocNow/hydrator/releases
1.2. Choose the install file for you operating system (OS)
1.3. Select to open the file
1.4. Follow the install instructions
1.5. Once the install has finished, run the Hydrator App.
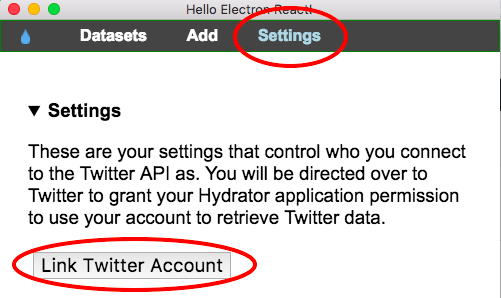
1.6. You will now need to link the Hydrator to your Twitter account.
1.7. If you are not automatically asked, choose settings, and ‘Link Twitter Account’
1.8. Select to Authorise the hydrator app
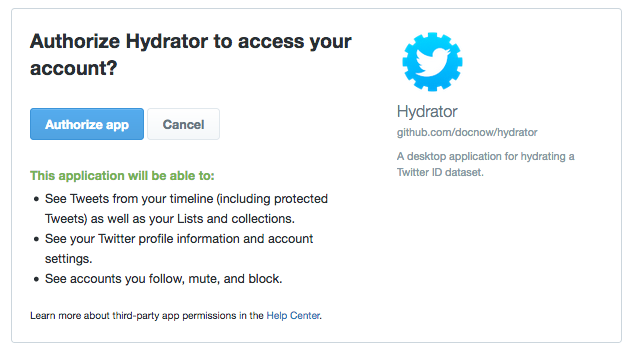
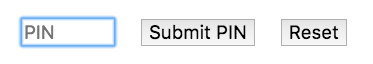
1.9. Copy and paste the pin you are given into Hydrator
You are now ready to hydrate your tweet-Ids.
2. Hydrating the data
2.1. Choose ‘Add’ in Hydrator
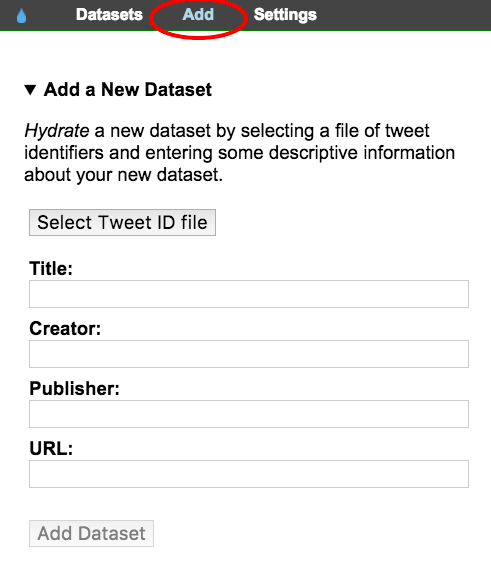
2.2. Click ‘Select Tweet ID file’
2.3. Add the .txt file generated in the previous stage (the one that is just a list of numbers).
2.4. Give your new output a useful name.
2.5. Add your name as the author, credit the dataset creator in the publisher field, and put the URL of the original dataset in the final field – this will help you with citing the data later
2.6. Click ‘Add Dataset’
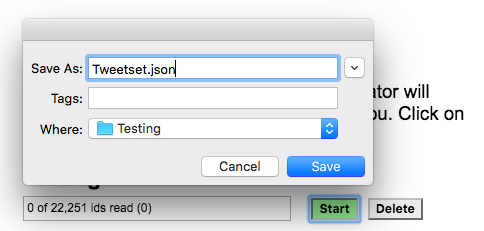
2.7. Click start on your dataset.
2.8. You will be asked for a file name, save it with something useful followed by .json
2.9. Now go and make a cup of tea – the hydration process can take some time.
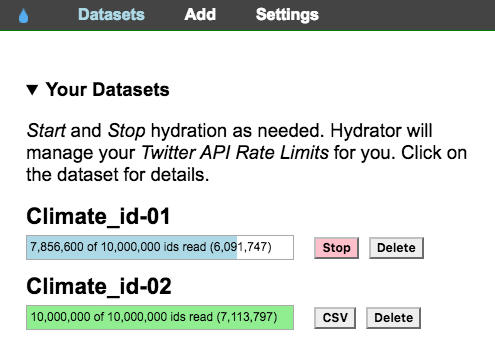
2.10. Once your file has finished hydrating click the CSV button
2.11 Save the .csv file in your project folder. – Make sure you add .csv to the end of the file name.
2.12 Open the .csv file in Excel, you will now see you have all the data from the tweets.

Blurred for privacy
You can now prepare your data for use in Gephi
The data collected can be searched and analysed in many different ways. However, to use it with a visualisation package like Gephi we need to clean the data and create nodes and edges for import. To do this we will need to use Python (3.5 or higher) – We are going to use Anaconda, which is a free user-friendly Python environment that comes with a host of Python packages for scientific computing and data analysis.
1. Installing the required applications
1.1. Download Anaconda for your operating system and the latest Python version, run the installer, and follow the steps. Detailed instructions on how to install Anaconda can be found in the Anaconda documentation.
We also need to add some extra databases to make this work, so…
1.2. In the Anaconda prompt (or terminal in Linux or MacOS), start JupyterLab:
1.3. In JupyterLab, create a new (Python 3) notebook:
1.4. In the first cell of the notebook, you can import pandas and check the version with:
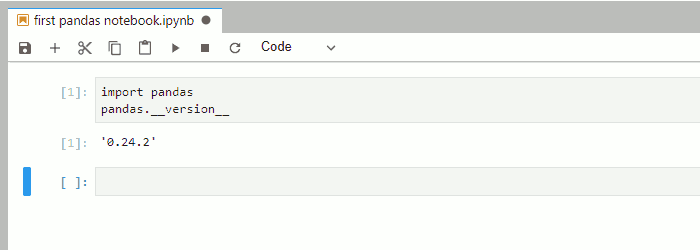
Now your pandas are ready, and we can begin to clean our data for Gephi.
2. Preparing data for processing
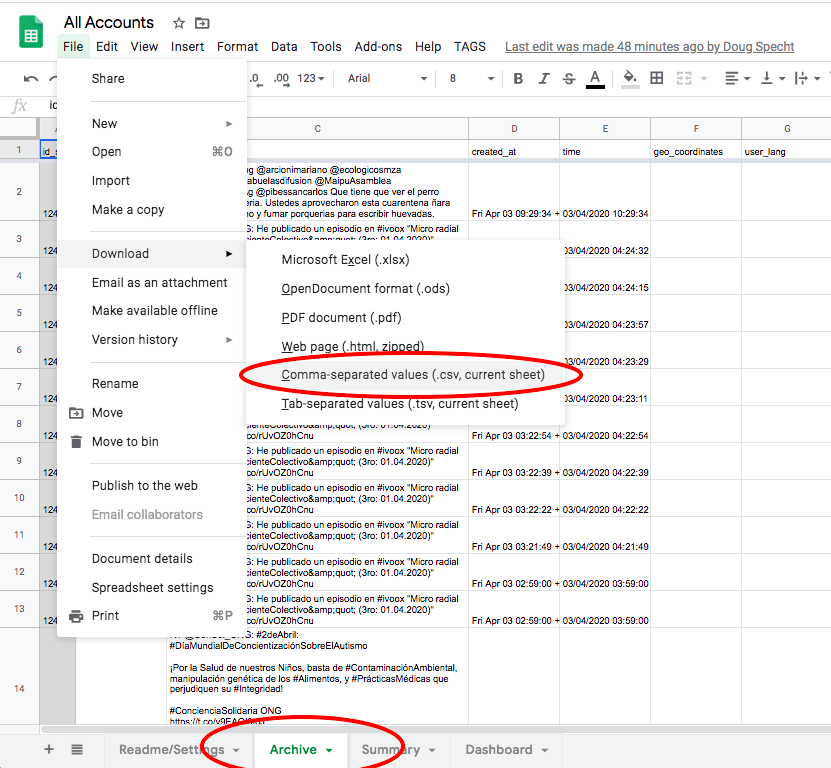
2.1. In your sheet (created in the previous stage) navigate to the ‘Archives’ sheet.
2.2. Choose File > Download > Comma-separated values (.csv, current sheet).
2.3. Save this file using a name without spaces, and in a new folder.
3. Running the code
The code presented below will create node and edge input tables for the social network analysis tools from the tweet datasets created in TAGSs.
3.1. You can now run one of 2 Python scripts to prepare your data for visual analysis. Use the links to download the appropriate script, and then follow the instructions below which are the same for all scripts
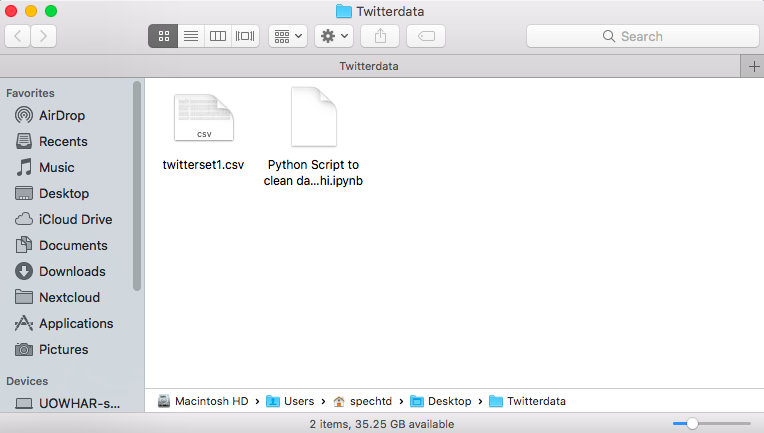
3.2. Extract the zip file into the same folder as your .csv file containing your tweets.
3.3. Open Anaconda and select ‘jupyter Notebook’
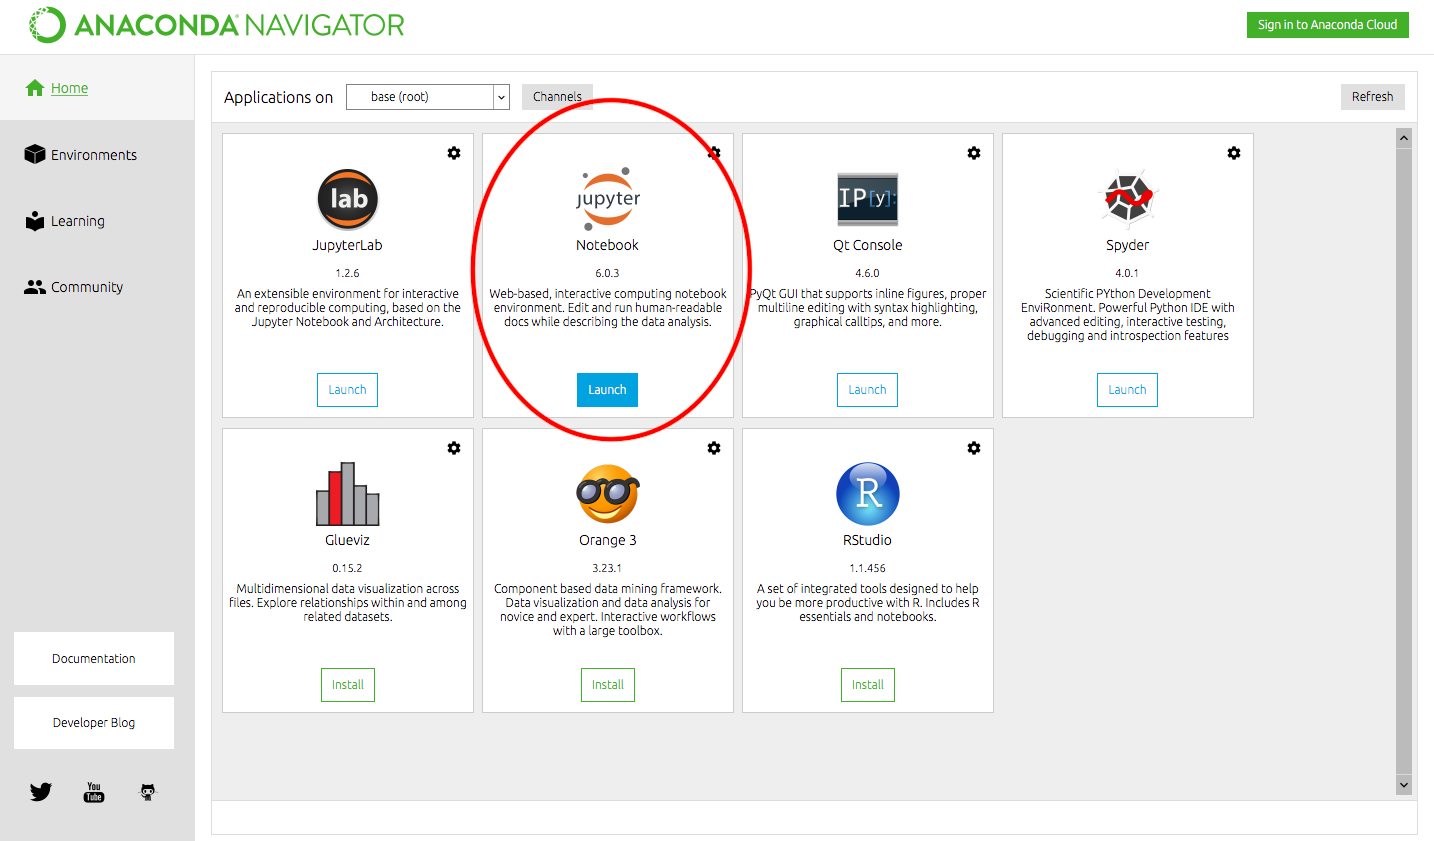
This will open in your browser window.
3.4. Navigate to the folder containing the .csv and .ipynb files
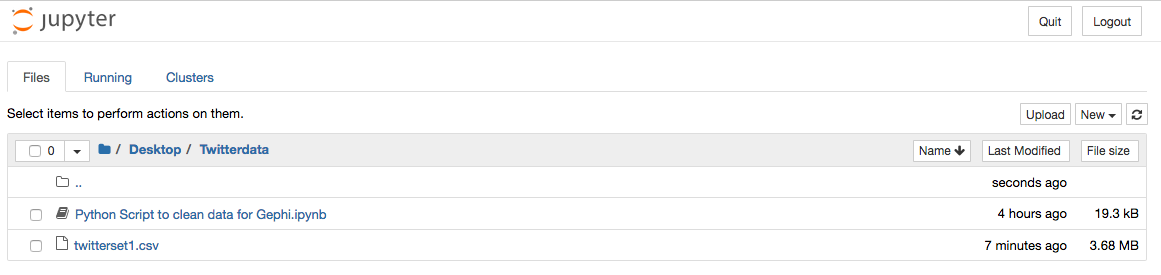
3.5. Open the ‘Python Script to Clean data for Gephi.ipynb’ file
3.6. Change the name of the file to in red to match the .csv file that contains your twitter data
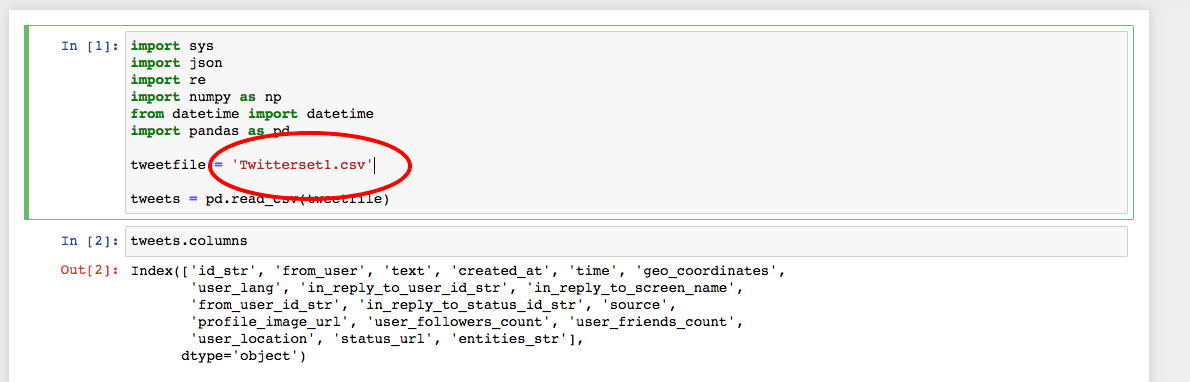
3.7. Click Run at the top of the page
Pressing run will run each part of the script one section at a time. Keep pressing run until the scrip reaches the end and creates a new text box like below:
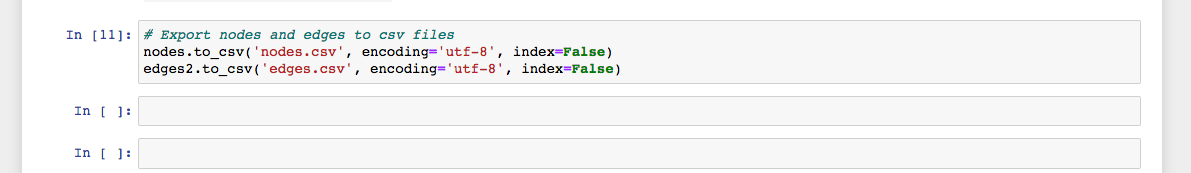
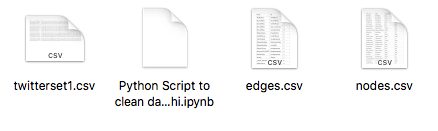
Your source folder will now contain two new .csv files ‘nodes’ and ‘edges’ – These we can import into Gephi in the next stage of the task.
We have now collected our Twitter data with TAGs and have converted it into edges and nodes. This means we can now load it into Gephi and create some visualisations of what is happening in our networks.
1. Installing Gephi
1.1. Gephi is free to use and can be downloaded from https://gephi.org/
1.2. Follow the install instructions. Support with installation can be found here: https://gephi.org/users/support/
2. Importing nodes and edges into Gephi
2.1. Open Gephi and choose ‘New Project’
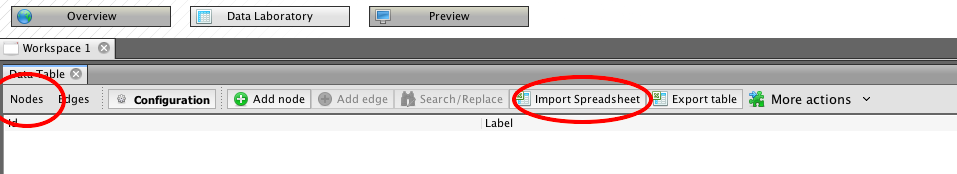
2.2. Navigate to the ‘Data Laboratory’ – Here you will see there are tabs for ‘nodes’ and ‘edges’
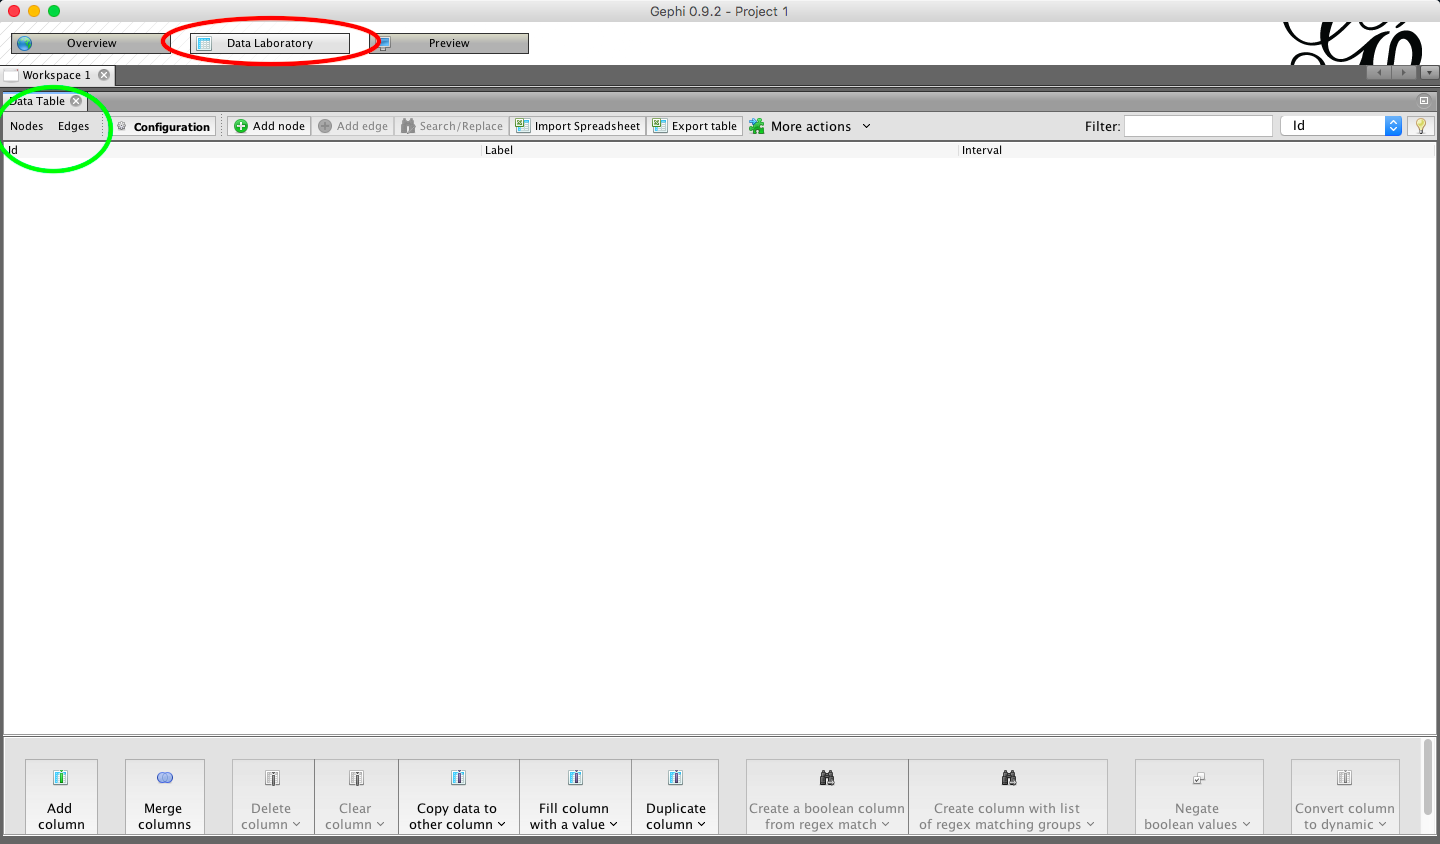
2.3. Chose ‘nodes’ and the select ‘import spreadsheet’
2.4. Fine the ‘nodes.csv’ file that we made using the python script in the previous stage.
2.5. You will be given a preview of the data you are importing – be sure to check it is importing as a ‘nodes table’
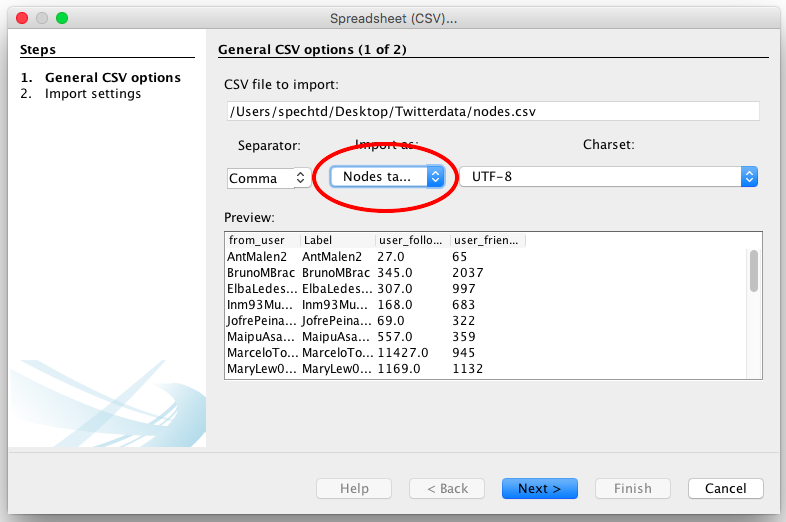
2.6. Click Next
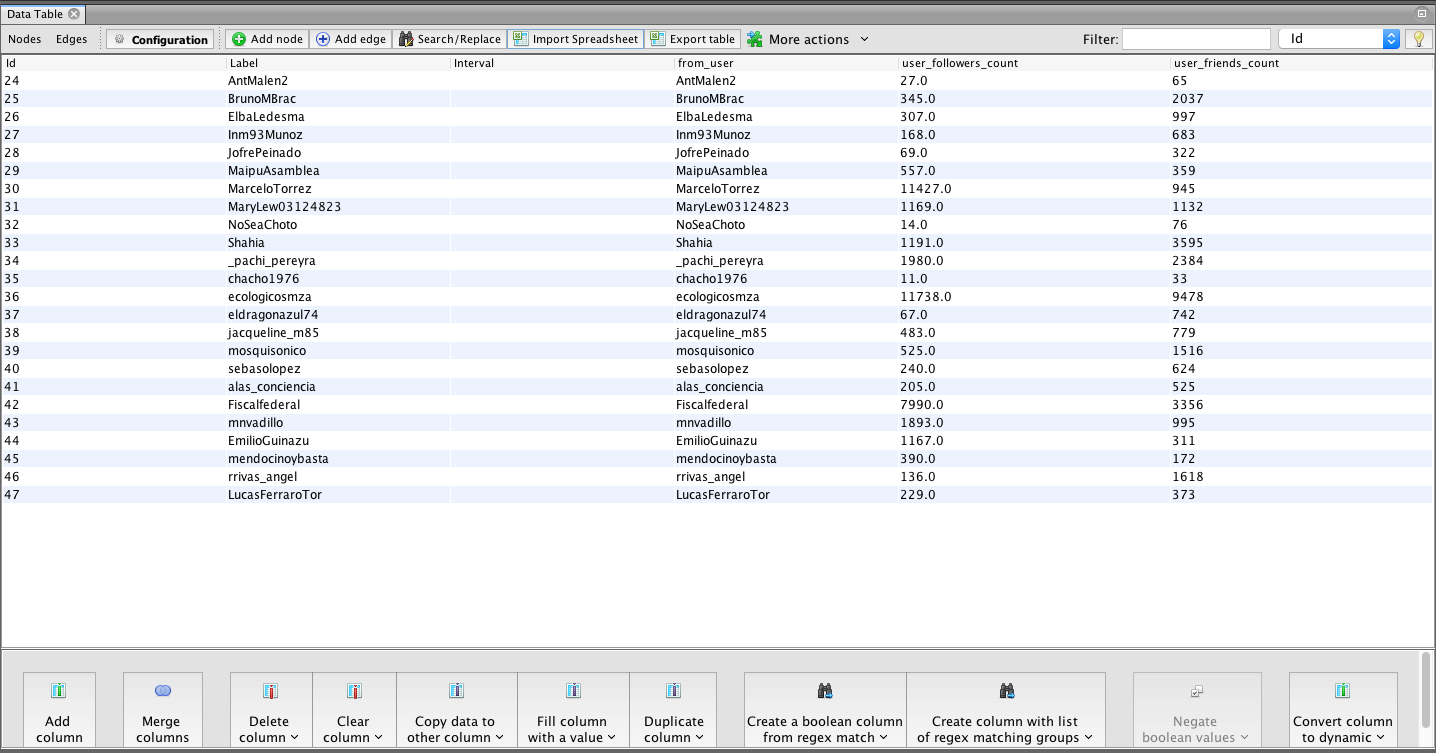
2.7. Import settings should be automatically selected by Gephi. Click Finish
2.8. Click ok on the next popup – you will now see your node data imported.
2.9. We need to repeat the process for edge data. Select ‘Edges’ and then ‘import spreadsheet’
2.10. Ensure that import type is selected as ‘Edges’.
2.11. Click Next
2.12. Import settings should again be automatically selected by Gephi
2.13. Ensure you select ‘Append to existing workspace’ so that the edges are added to your other data.
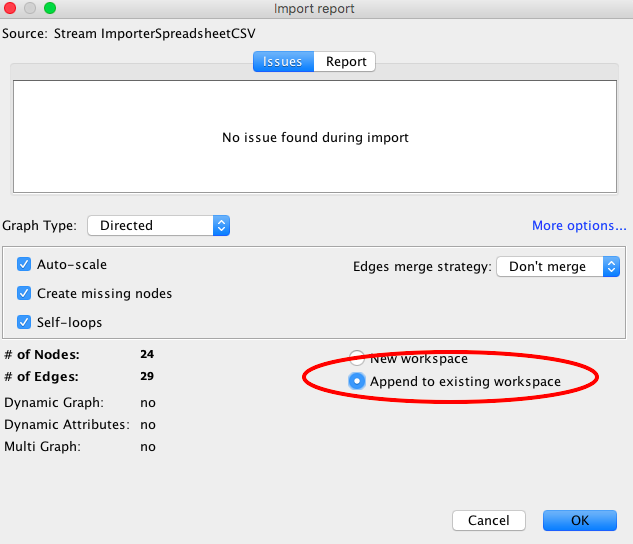
2.13. Click ok on the next popup – you will now see your edge data imported.
3. Running visualisations
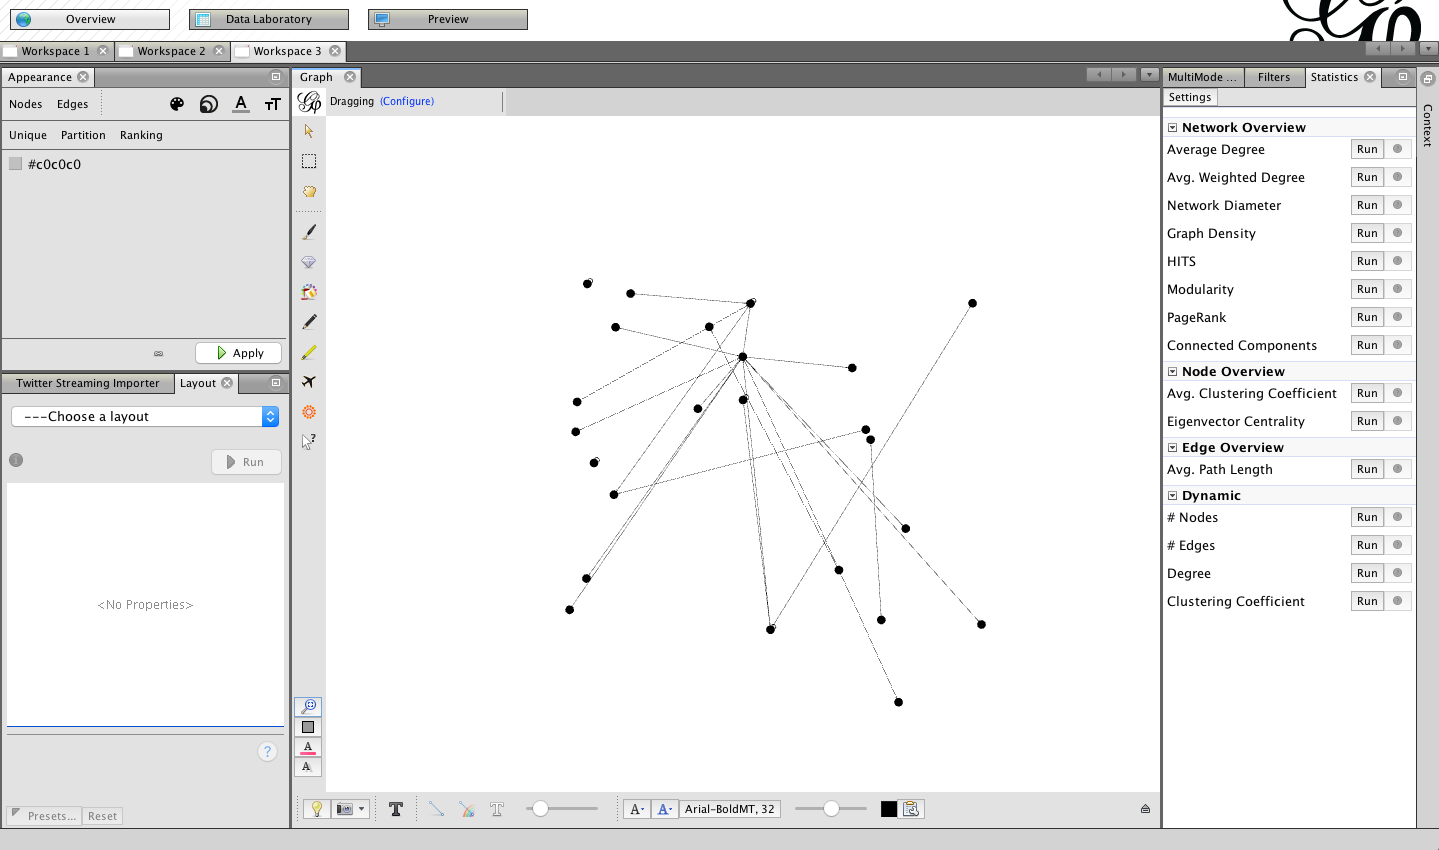
3.1. Choose ‘Overview from the top ribbon’
![]()
3.2. You will now be presented with a basic network map of the tweets you have collected.
You are now ready to process and visualise the data you have collected.
Head to my tutorial on Visualising networks using Gephi for help with that.